
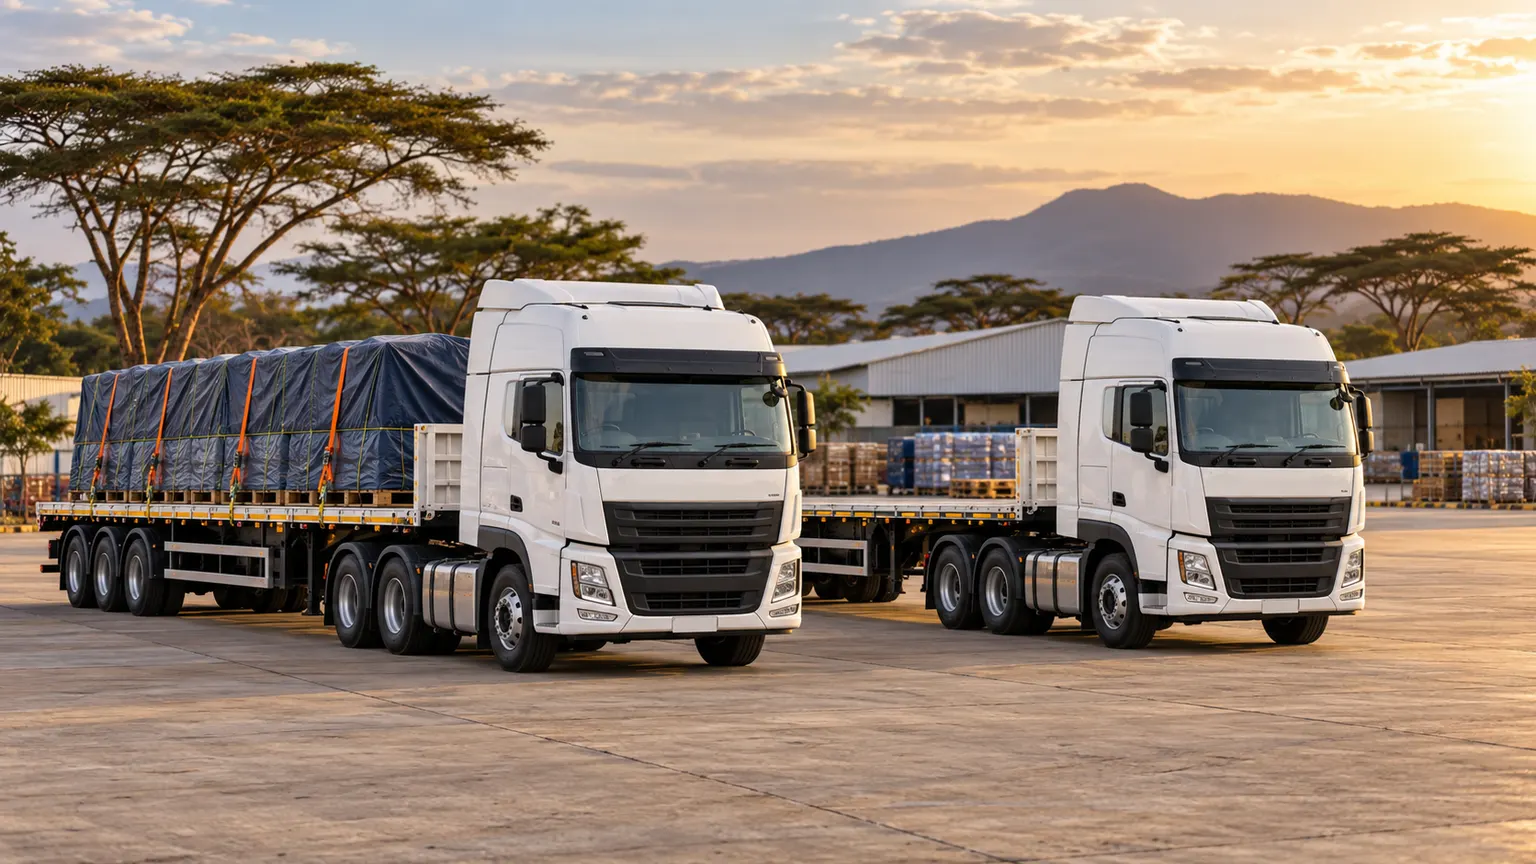
Compare a truck's loaded running with similar loaded work, and its empty running with similar empty work. One combined km/L figure can change simply because the mix of work changed. Separating the two helps a transport team decide whether rising fuel use comes from a different workload or deserves a closer operational review.
Why one fleet average can hide the real change
A truck spending more of the week carrying freight may show a different overall fuel figure even when its performance on comparable work is unchanged. Conversely, more empty kilometres can make a combined figure look better while the business earns less per kilometre. Fuel economy and commercial productivity answer different questions.
Load is only one influence. Direction, gradients, congestion, waiting, vehicle setup and maintenance condition also matter. Cummins' fuel economy guide discusses the effects of operating conditions, vehicle configuration and idling. Use that context to interpret a trend rather than choosing a universal km/L target.
Build two comparable groups
Begin with the same powered vehicle and reliable measurements. Keep Nairobi–Mombasa loaded running distinguishable from the return direction, even if both use the same road. Where the evidence allows, note payload, trailer type, unusual waiting and a material change in route or work.
- Loaded: periods whose records support the loaded classification.
- Empty: periods recorded as empty work, including the return leg.
- Mixed: periods covering both conditions without a reliable split.
- Unknown: periods with insufficient trip or measurement evidence.
Keep mixed and unknown periods visible without forcing them into either comparison. If an empty run picks up a backload, record the change. Dispatch intent alone does not establish what the truck actually carried for the whole journey.
Add kilometres and litres before calculating km/L
For each group, use total supported kilometres ÷ total corresponding litres. Include only distance and fuel measured over matching periods with a consistent measurement basis. Fuel bought during a trip is not automatically the fuel used on it; check the trip fuel balance first.
In a hypothetical loaded group, one trip covers 600 km using 300 litres and another covers 200 km using 80 litres. Together they cover 800 km using 380 litres, or approximately 2.11 km/L. Averaging the individual figures of 2.0 and 2.5 km/L would give 2.25 km/L and overstate the combined economy.
Apply the same method to the empty group. Retain the amount of measured running behind each result. A small or incomplete sample should not carry the same weight as a stable history of comparable work. These example values are not expected consumption rates.
Translate an economy decline into extra litres
Suppose comparable running changes from 2.0 km/L to 1.6 km/L. That is a 20% fall in distance per litre. For the same hypothetical 1,000 km, the earlier rate needs 500 litres and the later rate needs 625 litres: 125 extra litres, or 25% more fuel.
The percentages differ because one measures distance per litre and the other litres per fixed distance. To estimate the money difference, multiply the extra litres by the relevant recorded KES per litre. Name the price basis and period; do not present a hypothetical calculation as a current pump price or guaranteed saving.
Review a change in a useful order
- Validate the measurements. Check coverage, matching periods, fills and tank or counter issues.
- Check the work. Review load, route direction, waiting and any unusual operating conditions.
- Compare the same vehicle. Look for a sustained change against its own similar running.
- Arrange the appropriate check. Give the workshop or operations reviewer the evidence, without prescribing a diagnosis.
- Review the outcome. Compare subsequent similar work after a record correction or completed repair.
A difference can justify a conversation or a work order. It does not prove fuel theft, poor driving or a particular mechanical fault. Include the driver's account of the journey and the workshop's findings in the review.
Use the comparison alongside the trip margin
An empty return can use fewer litres yet still cost the company money. Review the fuel result alongside return-load planning, cost per kilometre and the journey's revenue and expenses. Do not optimise a fuel ratio while ignoring an unprofitable detour.
Kora's vehicle-health views support loaded and empty economy comparisons for authorised office users on Pro and eligible Enterprise packages, where trip records and supported measurements provide enough evidence. Incomplete history can leave a comparison unavailable. The result helps the team decide what to review; the operator and qualified workshop still establish the cause and action.