
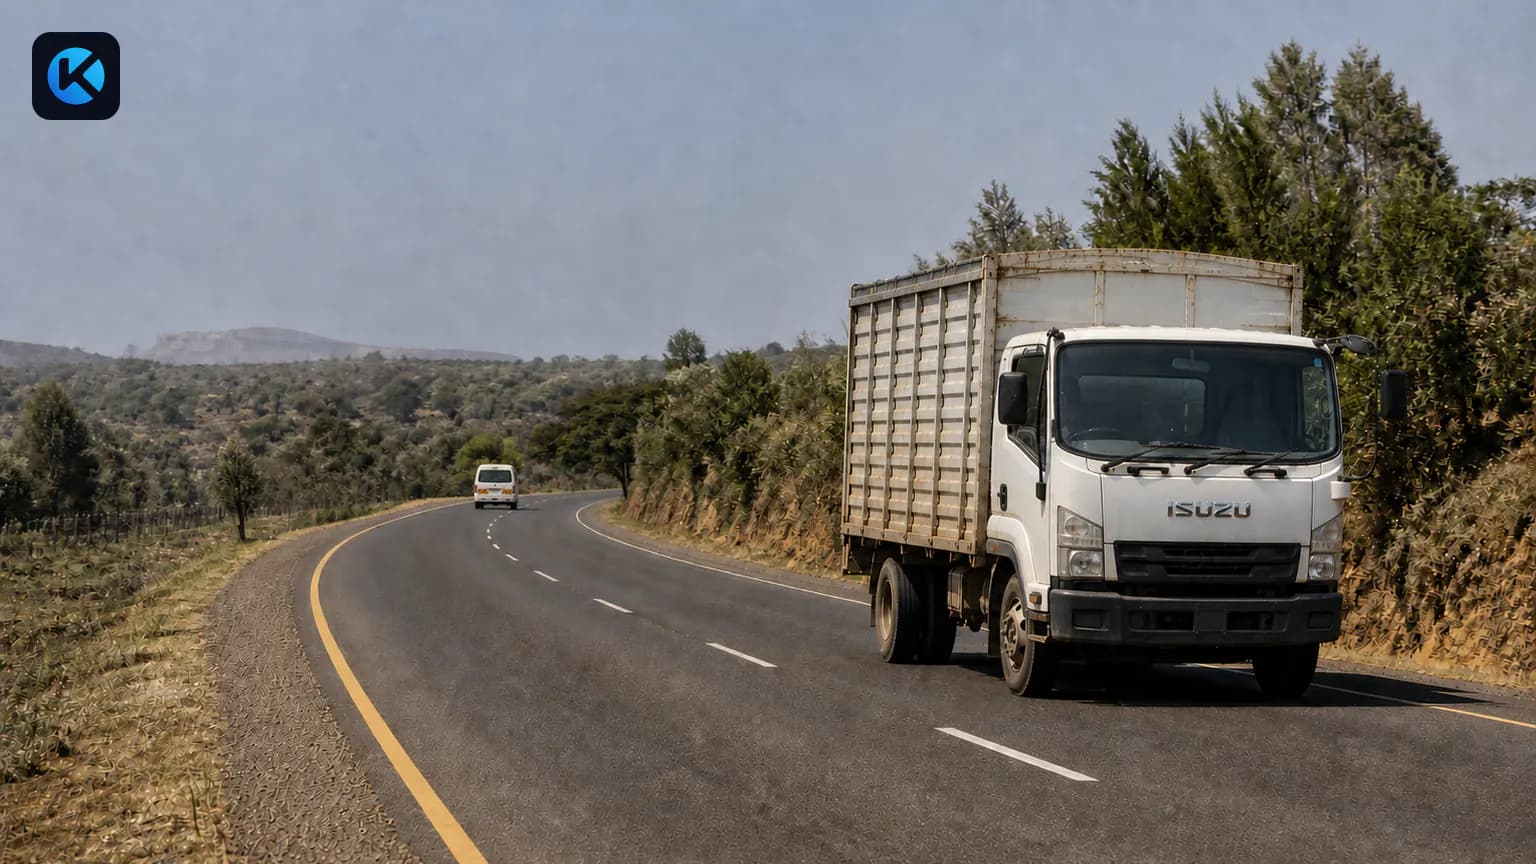
Ask five operators what a truck should do per litre and you will get five confident answers. Most will be borrowed from a different vehicle, a lighter load, an easier route, or a week when somebody forgot to record a fill. The arithmetic is simple. The difficult part is making sure the kilometres and litres describe the same work.
A useful fuel figure is not a promise from a brochure and it is not one good trip. It is a baseline learned from the vehicle itself: enough clean distance and complete fuel records to show what normal looks like before an unusual result is treated as a problem.
The two fuel-consumption formulas
Kenyan fleet teams usually speak in kilometres per litre. Reports may use litres per 100 kilometres instead. Both describe the same result from opposite directions.
km/L
distance ÷ litres
Higher is better. A truck covering 720 km on 360 L returns 2.0 km/L.
L/100 km
litres ÷ distance × 100
Lower is better. The same 720 km and 360 L equals 50 L/100 km.
To convert either way, divide 100 by the figure. A result of 2.0 km/L is 50 L/100 km. A result of 40 L/100 km is 2.5 km/L. Keep one unit on the vehicle record and in every report; switching formats halfway through a review creates mistakes that look like operational variance.
Run a clean full-to-full measurement
The most practical manual method is to return the tank to a consistent level after a known distance. The litres required to restore that level approximate what the truck consumed. It only works when every litre in between is counted.
- Use one vehicle, one odometer source, and one unit throughout the test
- Start and finish at a consistent tank level, ideally at the same pump and on level ground
- Record every litre added between the two readings, including top-ups away from the usual station
- Measure a meaningful working distance rather than a short depot run
- Note payload, route, idling, trailer use, and any maintenance issue that changed the duty
Illustrative worked example — not a Kenyan truck benchmark
Opening odometer: 184,220 km
Closing odometer: 184,940 km
Illustrative total added after the opening full tank, including the final refill to the same level: 360 L
Distance: 720 km · Economy: 2.0 km/L · Consumption: 50 L/100 km
A fuel gauge is useful for direction, not precise accounting. Tank shape is irregular, fuel moves on gradients and rough roads, and the top half of a gauge does not always represent the same litres as the bottom half. If your tracker reads tank level, use settled readings and trends rather than treating every percentage movement as a fill or a loss.
Keep the measurement independent
Record the fill against the vehicle, preserve the receipt, and take distance from the odometer or tracker. The person whose consumption is being measured should not be the only person who owns all three inputs.
Build a baseline for each vehicle, not one number for the fleet
Two trucks with the same badge can still do different work. One pulls a trailer on the Northern Corridor; another runs local drops in Nairobi traffic. One returns empty; the other carries dense cargo in both directions. Averaging them produces a neat number that describes neither truck.
Start with several clean fills and enough working distance to dilute the noise of one top-up, one hill, or one queue. Keep learning as the vehicle works. Compare a new trip with that vehicle's own established range and, where possible, with trips of similar route, payload, trailer, and traffic conditions.
Cost per kilometre then becomes useful. Divide the diesel price per litre by km/L. If the price changes, cost per kilometre changes even when the truck's physical economy does not, which is why litres and money should stay as separate measures in an operating review.
When the number looks wrong, audit the record before the driver
An impossible result is often a broken measurement window. Before treating variance as waste or theft, make sure the inputs belong together.
- A missed fill, duplicate receipt, or fill assigned to the wrong registration
- A typed odometer with a missing digit, a unit mismatch, or a tracker counter that restarted
- A partial fill compared with a previous full-tank reading
- Fuel transferred to a second tank, generator, refrigeration unit, or another vehicle
- A replaced tank or an incorrect tank-capacity figure on the vehicle record
- Two records captured on different dates even though the vehicle worked between them
Once the record survives that check, look for a change in the work or the vehicle.
- A heavier load, empty return, trailer, steep route, rough road, or long congestion window
- Extended idling, power take-off work, refrigeration, or other engine-driven auxiliary load
- Low tyre pressure, brake drag, alignment problems or an engine condition requiring diagnosis
- Harsh acceleration, speeding, high engine revs, or repeated route deviation
- A level drop while parked, litres that exceed physical tank capacity, or repeated rapid refills
None of those signals is a verdict by itself. A 20% change on one short trip is a reason to look. The same change across repeated comparable trips, supported by location, engine-hours, maintenance, and tank-level evidence, is a reason to act.
Turn the baseline into an operating control
A spreadsheet can calculate km/L. A useful operating review also needs the corresponding route, payload, fuel records and maintenance context. Telemetry may supply distance or running time where supported, but neither should be assumed available on every device.
Keep those records on one timeline and the review question changes from “Why did we spend so much on diesel?” at month-end to “What changed on this vehicle on this trip?” while the evidence still exists. For the hardware side of that record, read the guide to fuel monitoring systems in Kenya. For the investigation workflow, see how fleets can make unexplained diesel loss visible.
Frequently asked questions
How do I calculate truck fuel consumption in km per litre?
Divide the distance travelled by the litres consumed. If a truck covers 720 km on 360 litres, its economy is 2.0 km/L. Use distance and fuel from the same measurement window, and include every fill made during that window.
What is the difference between km/L and L/100 km?
Kilometres per litre shows how far the vehicle travels on one litre, so a higher number is better. Litres per 100 km shows how much fuel it burns over 100 km, so a lower number is better. Convert between them with 100 ÷ km/L or 100 ÷ L/100 km.
What is good fuel consumption for a truck in Kenya?
There is no honest universal figure because truck class, engine, payload, trailer, route, road surface, congestion, idling, and driving style all change consumption. The useful benchmark is the same vehicle doing comparable work over enough clean trips to establish its own normal range.
Why is a full-to-full test more reliable than the dashboard fuel gauge?
A dashboard gauge estimates level and can move with road slope, tank shape, and fuel slosh. A consistent full-to-full test measures the litres required to return the tank to the same level after a known distance, which gives a stronger consumption figure when every intermediate fill is recorded.
Can high fuel consumption prove diesel theft?
No. High consumption is a review signal, not proof of theft. First rule out bad records, payload and route changes, idling, tyre or brake problems, maintenance issues, and auxiliary equipment; then investigate unexplained repeated variance alongside tank-level and vehicle-location evidence.